The State of Halal ETFs 2026: Every Fund Screened, Holding by Holding
Halal Terminal Research, July 2026
⚠️ IMPORTANT LEGAL NOTICE (click to expand)
This document is general educational research. It is provided for informational purposes only and does not constitute investment advice, portfolio management, a solicitation, or any inducement to transact in any financial instrument.
No personalization. The analysis does not take into account any individual's financial situation, objectives, or risk profile.
Not a fatwa. Compliance figures are computed from public financial disclosures under the five methodologies described in §3. Results are not a religious ruling and should not substitute for guidance from a qualified Islamic scholar or Shariah advisor.
Point-in-time snapshot. All figures reflect a single snapshot date, July 20, 2026. Fund holdings, verdicts, and returns change continuously; nothing here implies the future composition, compliance profile, or performance of any fund.
Data and scope. Figures are derived from regulatory N-PORT filings, market data, and the Halal Terminal engine as of the snapshot date. Fund names and tickers appear solely as screening outcomes and descriptive facts, never as recommendations.
Regulatory positioning. This text is intended to qualify as non-advisory research / educational analysis under Swiss regulatory expectations (FinSA / FINMA), with a focus on methodology, evidence, and limitations.
For complete disclaimers, see Legal Disclaimers.
1. Executive Summary
A halal ETF puts a promise on its label: hold the fund and, by construction, every dollar inside it is screened against a Shariah methodology. This study takes that promise seriously and tests it the only way it can be tested: by opening every fund, pulling its holdings from regulatory N-PORT filings, and running each individual holding through all five major Shariah screening standards (AAOIFI, Dow Jones Islamic Market, FTSE Shariah, MSCI Islamic, and S&P Shariah) with the same engine that powers Halal Terminal's customer-facing verdicts. Three headline findings emerge.
First, the halal ETF universe in 2026 is small, concentrated, and, over the last twelve months, unusually strong. We count 13 funds, roughly $9B in combined assets, with expense ratios running from 0.40% to 0.85%. Over the trailing twelve months, every major halal equity ETF beat SPY's +19.3%: SPTE returned +42.4%, UMMA +36.5%, SPWO +30.1%, HLAL +29.7%, and SPUS +24.2%. This is not manager magic; it is the structural tech tilt of Shariah screening at work. Removing conventional financials and leveraged sectors mechanically overweights the technology complex, and in a twelve-month window when that complex led the market, the screened funds led with it. The exceptions prove the rule: SPRE, the REIT fund, returned +16.4%, and MNZL +18.1%, both trailing SPY, because neither carries the full tech concentration.
Second, the look-through finding: even inside halal-labeled funds, cross-standard agreement is partial. When each holding is screened under all five standards at once, 74.7% of SPUS's covered weight passes all five, and 84.0% of HLAL's. But SPRE collapses to 19.5%, because REIT leverage breaches the asset-based FTSE and MSCI screens for most of its names, and SPTE falls to 60.3%. Every fund in the study is compliant under its own stated methodology; the point is that "halal ETF" is not one thing. It is a fund-by-fund answer to the question "halal under which standard?", and the answers differ by as much as 64 percentage points of portfolio weight.
Third, the US broad-market funds are near-substitutes for each other. SPUS and HLAL share 67.6% of portfolio weight; SPUS and MNZL share 65.6%. Holding two of the big three US funds is largely holding the same portfolio twice. The consequential portfolio decision is not between the big three; it is between sleeves: a US core, a technology tilt (SPTE), international exposure (SPWO, UMMA), real estate (SPRE), and fixed income (SPSK, the sukuk fund), which overlap with each other barely at all.
The rest of this study documents the full landscape, the methodology, the look-through table, the specific names driving the cross-standard gaps, the overlap matrix, and purification, with the limitations stated plainly.
2. The 2026 Landscape
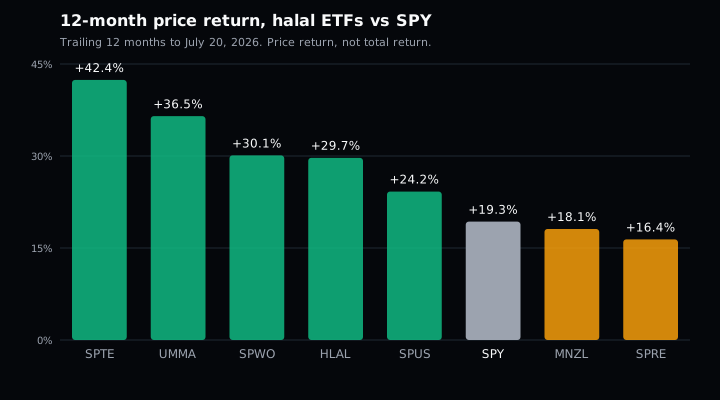
Thirteen funds carry an explicit Shariah or halal mandate at scale in 2026. Where a figure could not be resolved from filings or market data, the cell says n/d rather than a guess.
| Ticker | Fund | Expense ratio | AUM | Holdings | 12m return |
|---|---|---|---|---|---|
| SPUS | SP Funds S&P 500 Sharia Industry Exclusions ETF | 0.45% | $2,847M | 212 | +24.2% |
| ISWD | iShares MSCI World Islamic UCITS ETF USD (Dist) | 0.60% | $1,469M | 10* | n/d |
| IGDA | Invesco Dow Jones Islamic Global Developed Markets UCITS ETF | n/d | $1,093M | n/d | n/d |
| HLAL | Wahed FTSE USA Shariah ETF | 0.50% | $925M | 197 | +29.7% |
| ISDE | iShares MSCI EM Islamic UCITS ETF USD (Dist) | 0.85% | $813M | n/d | n/d |
| SPSK | SP Funds Dow Jones Global Sukuk ETF | 0.50% | $638M | 169 | n/d |
| WSHR | Wealthsimple Shariah World Equity Index ETF | n/d | $484M (CAD) | n/d | n/d |
| UMMA | Wahed Dow Jones Islamic World ETF | 0.65% | $301M | 95 | +36.5% |
| SPTE | SP Funds S&P Global Technology ETF | 0.55% | $224M | 100 | +42.4% |
| SPRE | SP Funds S&P Global REIT Sharia ETF | 0.50% | $212M | 28 | +16.4% |
| SPWO | SP Funds S&P World (ex-US) ETF | 0.55% | $200M | 377 | +30.1% |
| AMAL | Saturna Al-Kawthar Global Focused Equity UCITS ETF (formerly Saturna Al-Kawthar (formerly Almalia Sanlam)) | 0.75% | $22M | n/d | n/d |
| MNZL | Manzil Russell Halal USA Broad Market ETF | 0.40% | $22M | 462 | +18.1% |
Benchmark: SPY 12m return +19.3%. WSHR's AUM is denominated in Canadian dollars. *ISWD's holdings count reflects the rows that resolve in our data, not the fund's full portfolio; UCITS disclosure formats do not map cleanly to our pipeline (see §3).
A few observations on the shape of this table.
Concentration. SPUS alone holds $2,847M, roughly a third of the universe. The top four funds account for well over two thirds of total assets. This is still a young category: the entire 13-fund universe is smaller than a single mid-sized conventional sector ETF.
Fees. The range runs from MNZL's 0.40% to ISDE's 0.85%. There is no sub-0.10% option of the kind conventional index investors take for granted; Shariah screening, index licensing, and small asset bases keep the category's cost floor higher.
Structure. Eleven of the thirteen are equity funds. SPSK is the category's fixed-income option: 169 sukuk holdings, a fundamentally different instrument from the equity funds and the only one of its kind in the table. AMAL is the sole actively managed fund; per the underlying data, AMAL resolves to the Saturna Al-Kawthar Global Focused Equity UCITS ETF (formerly Saturna Al-Kawthar (formerly Almalia Sanlam)).
Performance. The twelve-month column is striking: every US-listed halal equity fund with a resolvable return except SPRE and MNZL beat SPY, several by wide margins. §1 gives the structural reading; our companion study of the S&P 500 documents the mechanism in detail, sector by sector. The flip side deserves equal billing: a tech-tilted portfolio that outruns the index in a tech-led year will lag it in a year when financials and utilities lead. The tilt is structural; the direction of its payoff is not.
3. Methodology
Holdings. For US-listed funds, holdings and weights come from regulatory N-PORT filings, the standardized portfolio disclosures that US funds file with their regulator. This makes the study reproducible from public documents.
Screening. Each resolved holding was screened by the Halal Terminal engine under five methodologies: AAOIFI (Shariah Standard No. 21), DJIM (Dow Jones Islamic Market), FTSE Shariah, MSCI Islamic, and S&P Shariah. Each methodology applies a business-activity screen (excluding conventional banking and insurance, alcohol, tobacco, gambling, and certain entertainment businesses) plus financial-ratio screens (interest-bearing debt, interest-bearing cash and investments, impermissible income) whose thresholds and denominators differ per standard. The same engine and the same rule implementations were used for every fund, which is what makes the cross-fund comparison apples-to-apples.
Look-through scope. Cross-standard screening is reported for the 5 US-listed equity funds whose holdings resolve unambiguously to screened issuers: SPUS, HLAL, SPTE, SPRE, and MNZL. Coverage for these five runs from 90% to 100% of portfolio weight. International and UCITS funds are excluded from the cross-screening section for a reason worth stating plainly: their holdings files identify positions by bare local tickers, and bare local tickers misresolve. "SAN" could be Sanofi or Banco Santander. "AI" could be Air Liquide or C3.ai. A screening verdict attached to the wrong company is worse than no verdict, so where identifiers are ambiguous, we exclude rather than guess. Excluding beats guessing; the funds outside the look-through scope appear at fund level only.
SPSK is excluded from equity cross-screening by nature: it holds sukuk, not stocks, and equity ratio screens do not apply to it.
Snapshot date. One date: July 20, 2026. Holdings reflect the most recent N-PORT filings available on that date; verdicts reflect the most recent financial statements available on that date; returns are trailing twelve-month price returns to that date.
Sources. Regulatory N-PORT filings, the Halal Terminal engine, and market data. No third-party compliance list was consulted; every verdict is computed independently from the same underlying financial statements.
4. The Look-Through Table
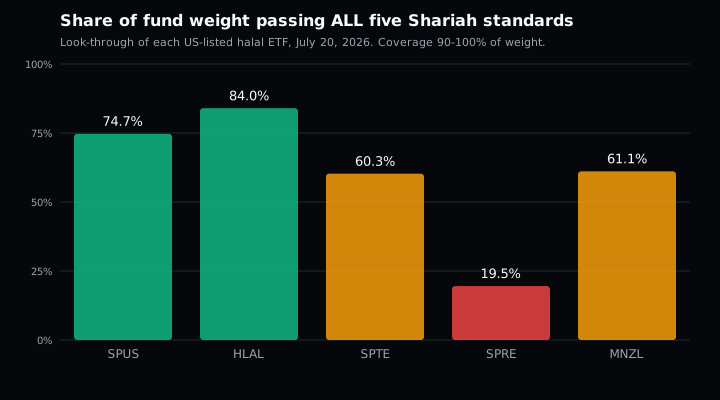
This is the core of the study. For each of the five in-scope funds, the table shows the percentage of covered holding weight that passes each standard, and the percentage that passes all five simultaneously.
| Fund | Coverage | AAOIFI | DJIM | FTSE | MSCI | S&P Shariah | All 5 |
|---|---|---|---|---|---|---|---|
| SPUS | 100% | 97.7% | 99.0% | 75.2% | 75.3% | 99.1% | 74.7% |
| HLAL | 100% | 96.8% | 96.5% | 86.6% | 86.6% | 96.3% | 84.0% |
| SPTE | 99% | 84.4% | 86.1% | 60.5% | 60.5% | 85.4% | 60.3% |
| SPRE | 90% | 64.6% | 69.9% | 20.4% | 20.4% | 69.9% | 19.5% |
| MNZL | 100% | 93.6% | 94.6% | 64.7% | 65.3% | 94.0% | 61.1% |
Three patterns organize the whole table.
The two-cluster structure carries over from single stocks to funds. The AAOIFI, DJIM, and S&P Shariah columns sit at 84% to 99% for every fund except SPRE; the FTSE and MSCI columns are consistently and sometimes dramatically lower. The mechanics are the same ones documented name by name in our S&P 500 study: FTSE and MSCI test leverage against total assets, a denominator that does not inflate with the market, while DJIM and S&P Shariah test it against trailing market capitalization, which at 2026 valuations is large relative to balance sheets. FTSE and MSCI also apply a broader liquidity numerator, capping cash plus interest-bearing securities rather than the narrower cash reading. A holding whose debt is comfortable against its market cap can breach the same threshold against its assets, and when that holding is 4% of a fund, the fund's FTSE column drops by 4 points at a stroke.
SPRE is the extreme case, and the reason is structural, not incidental. The fund holds 28 REITs, and real estate investment trusts are habitually debt-financed: leverage above 33% of assets is the sector's normal operating condition. Under the asset-based FTSE and MSCI screens, most of SPRE's portfolio breaches the debt threshold, and the fund's pass rate collapses to 20.4% under both. Under the AAOIFI-family treatments the same portfolio scores 64.6% to 69.9%. No other fund in the table shows a 45-point spread between clusters; SPRE is what happens when an entire asset class sits on the wrong side of one denominator convention.
An important framing note, stated explicitly. HLAL tracks a FTSE Shariah index, yet scores 86.6% under our FTSE implementation. SPUS tracks an S&P Shariah index variant and scores 99.1% under our S&P Shariah implementation, not 100%. This does not mean any fund is violating its own index, and we want to be unambiguous about that. Our figures come from an independent implementation of each standard's published rules applied to standardized filing data. Official index committees additionally apply buffer rules (a constituent near a threshold is not ejected the moment it crosses), committee judgment on borderline classifications, and review calendars, and they may work from different data vintages than the filings our engine reads. A gap between a fund and our implementation of its own index family measures the distance between published rules read literally and an index run by a committee; it is a property of the methodology ecosystem, not an accusation against any fund. Every fund in this table is, to our knowledge, fully compliant with its own stated index methodology.
What the table does establish is this: a fund's label tells you which standard it follows, and the look-through tells you how much of it would survive the other four. For an investor whose personal or institutional standard is FTSE- or MSCI-style asset-based screening, the difference between 84.0% (HLAL) and 19.5% (SPRE) of weight passing is real, computable information that the fund label alone does not carry.
5. The Names Behind the Gaps
Aggregates hide the mechanism, so here are the heaviest holdings in each fund that fail at least one standard, with the standards they fail. Weights are percentages of the fund.
SPUS: AVGO 4.7% (fails FTSE, MSCI); LLY 2.6% (fails FTSE, MSCI); ABBV 1.3% (fails FTSE, MSCI); PG 1.2% (fails FTSE, MSCI); HD 1.2% (fails FTSE, MSCI).
HLAL: LLY 2.7% (fails FTSE, MSCI); PG 1.4% (fails FTSE, MSCI); MRK 1.1% (fails FTSE, MSCI); LRCX 1.1% (fails FTSE, MSCI); KLAC 0.7% (fails FTSE, MSCI).
SPTE: TSM 11.6% (fails FTSE, MSCI); AVGO 4.8% (fails FTSE, MSCI); the Taiwan-listed holding 2454 at 4.8% (fails all five); the Taiwan-listed holding 2308 at 4.7% (fails all five); SHOP 1.7% (fails FTSE, MSCI).
SPRE: EQIX 13.8% (fails FTSE, MSCI); PLD 12.5% (fails FTSE, MSCI); GMG 11.6% (fails all five); SUI 5.1% (fails all five); ELS 4.9% (fails FTSE, MSCI).
MNZL: AVGO 7.3% (fails FTSE, MSCI); LLY 2.8% (fails FTSE, MSCI); ABBV 1.4% (fails FTSE, MSCI); PG 1.3% (fails FTSE, MSCI); HD 1.2% (fails FTSE, MSCI).
Two things stand out.
The dominant failure pattern is FTSE plus MSCI, and it repeats across funds. AVGO, LLY, ABBV, PG, HD, MRK, LRCX, KLAC: these are household-name semiconductor, pharmaceutical, and consumer-staples companies with unquestionably permissible core businesses, split purely by which denominator their debt is measured against. SPTE's largest position, TSM at 11.6% of the fund, follows the same pattern, and because the position is so large, it single-handedly explains a large share of SPTE's 25-point gap between its DJIM and FTSE columns.
The cross-study coherence is the strongest validation in this report. These are the same split-verdict names our S&P 500 snapshot study identified at the single-stock level: AVGO, LLY, ABBV, PG, HD, KO, and MRK all pass AAOIFI, DJIM, and S&P Shariah while failing FTSE and MSCI there too. The ETF look-through and the index study were computed from the same engine but different holdings files, and they surface the same disagreement zone. The gaps in §4 are not noise in our pipeline; they are the S&P 500's split-verdict names showing up, weighted, inside the funds that hold them.
The all-five failures are rarer and more interesting. In SPRE, GMG (11.6%) and SUI (5.1%) fail every standard, which means the AAOIFI-family screens reject them too; these are the REITs whose leverage breaches even the market-cap-based configurations. In SPTE, the two Taiwan-listed holdings at 4.8% and 4.7% fail all five. A fund can be compliant under its own index while carrying individual positions that no major standard would pass in isolation, because index-level rules (buffers, grandfathering, committee treatment) operate at a different altitude than a position-by-position snapshot screen. That, again, is a statement about how the ecosystem works, not about any fund's integrity.
6. Overlap: The Big Three Are Near-Substitutes
For every pair of in-scope funds (plus SPWO and UMMA, whose holdings resolve well enough for overlap arithmetic even though their international sleeves are excluded from cross-screening), we computed weight overlap: the sum of the minimum weights on common names.
| Pair | Weight overlap | Common names |
|---|---|---|
| SPUS-HLAL | 67.6% | 133 |
| SPUS-MNZL | 65.6% | 189 |
| HLAL-MNZL | 62.0% | 171 |
| SPUS-SPTE | 50.1% | 55 |
| SPWO-UMMA | 37.0% | 32 |
| HLAL-SPTE | 32.1% | 33 |
| SPTE-MNZL | 31.1% | 46 |
| SPTE-SPWO | 25.4% | 37 |
| SPTE-UMMA | 19.0% | 5 |
| SPRE-MNZL | 1.9% | 11 |
| SPUS-SPRE | 1.3% | 7 |
| HLAL-SPRE | 0.6% | 3 |
| SPRE-UMMA | 0.4% | 1 |
| SPWO-SPRE | 0.2% | 1 |
| MNZL-UMMA | 0.1% | 2 |
| SPWO-MNZL | 0.1% | 2 |
| HLAL-SPWO | 0.1% | 2 |
| HLAL-UMMA | 0.1% | 1 |
| SPUS-UMMA | 0.1% | 1 |
The reading is direct. The three US broad-market funds are near-substitutes. SPUS and HLAL overlap on 67.6% of weight across 133 common names; SPUS and MNZL on 65.6%; HLAL and MNZL on 62.0%. They track different index families (S&P Shariah, FTSE Shariah, Russell-based), but Shariah screening applied to the same US large-cap universe converges on largely the same portfolio: the compliant mega-cap technology complex plus the same pharmaceutical, industrial, and consumer names. An investor holding two of the three is roughly two-thirds duplicated.
The bottom of the table is the mirror image. SPRE overlaps with everything else at 1.9% or less. UMMA and SPWO overlap with the US funds at 0.1%. SPSK, as a sukuk fund, shares no equity holdings with any of them by construction.
Put together, the two halves of the table describe the actual structure of the halal ETF universe: not thirteen alternatives, but a small set of distinct sleeves. A US core (where SPUS, HLAL, and MNZL are variations on one portfolio), a concentrated technology tilt (SPTE, which still overlaps its US siblings at 31% to 50% because the US core is already tech-heavy), international equity (SPWO, UMMA, and the UCITS funds), real estate (SPRE), and sukuk fixed income (SPSK). Described neutrally: combinations across sleeves change a portfolio's exposures materially; combinations within a sleeve mostly do not. Which sleeves belong in any given portfolio, and in what proportion, is a question for the investor and their own advisor, not for this study.
7. Purification
Passing a screen does not mean a company's revenue is perfectly pure. Every standard tolerates a small sliver of impermissible income (interest earned on corporate cash, minor non-compliant revenue lines) below its threshold, and the conventional remedy is purification: donating the impermissible fraction of dividends received to charity. For a fund investor, the fund's purification burden is the weighted sum of its holdings' burdens, so we computed per-name purification rates for the covered compliant holdings of each in-scope fund.
| Fund | Median purification rate | 90th percentile | Names (n) |
|---|---|---|---|
| SPUS | 0.32% | 1.59% | 192 |
| HLAL | 0.38% | 1.48% | 167 |
| SPTE | 0.63% | 2.55% | 75 |
| SPRE | 0.63% | 2.09% | 7 |
| MNZL | 0.24% | 2.03% | 370 |
The rates are percentages of dividends, not of assets, and they are small: the typical compliant holding in a US broad fund asks for roughly a quarter to a third of one percent of each dividend to be purified, and even the 90th percentile name in the heaviest fund asks for about two and a half percent. At these levels purification is an accounting discipline, not a material cost, but it is a real obligation under the methodologies that prescribe it, and it varies enough across funds (MNZL's 0.24% median versus SPTE's 0.63%) to be worth computing rather than assuming. Halal Terminal computes per-name purification rates from the same filings that drive the compliance verdicts.
8. Limitations
The honest boundaries of this study:
- →A single snapshot. Every figure is dated July 20, 2026. Funds rebalance, companies file new balance sheets, and verdicts move; our companion study, Dynamic Shariah Compliance: An Eight-Quarter Trajectory Study of the S&P 500, measures exactly how much verdicts move over time.
- →Five-fund look-through scope. Cross-standard screening covers only the 5 US-listed equity funds whose holdings resolve unambiguously (coverage 90% to 100% of weight). International and UCITS funds are excluded because bare local identifiers misresolve, and we prefer a smaller honest scope to a larger guessed one. Their look-through numbers may look better or worse than the US funds'; we do not know, and neither does anyone screening ambiguous identifiers.
- →Our implementations versus official committees. All cross-standard figures come from the Halal Terminal engine's implementation of each standard's published rules. Official index committees apply buffers, judgment, and review calendars that a pure rules engine does not replicate. As stated in §4, a fund scoring below 100% under our implementation of its own index family reflects rule-reading differences, not a violation by the fund.
- →Performance figures are twelve-month price returns, not total returns; they exclude distributions, and they describe one specific twelve-month window that happened to favor the sector tilt Shariah screening produces. Past performance is not indicative of future results, and nothing in §1 or §2 is a projection.
- →UCITS and international funds are shown at fund level only, with n/d where figures could not be resolved, and holdings counts for those funds reflect what resolves in our data rather than full portfolios.
- →Educational only. Nothing here is a fatwa, a recommendation, or advice. The correct use of this study is to understand how the halal ETF universe is structured and how the standards interact with it, then apply your own chosen methodology, with your own scholarly guidance, to your own decisions.
9. Screen It Yourself
Every number in this study came out of the same engine you can use directly:
- →Start with the funds. The halal ETF hub covers each fund in this study with holdings, screening context, and per-fund detail pages.
- →Check any holding free at /stocks: per-name verdicts under all five standards, with the failing ratios shown, not just a binary answer.
- →For portfolios, Halal Terminal screens full holdings lists, tracks verdict changes as new filings land, and computes purification amounts per position.
- →Read the companions. How Much of the S&P 500 Is Halal in 2026? documents the single-stock disagreement zone that §5 showed reappearing inside the funds, and the eight-quarter trajectory study measures how verdicts move over time.
The look-through table is the reason this study exists: a fund label names one standard, but a portfolio is hundreds of individual verdicts under five. Now you can ask the question properly, fund by fund and holding by holding.
Key Findings (Non-Prescriptive)
- 1Halal ETFs beat SPY this year: every major halal equity ETF outperformed SPY's +19.3% over the trailing 12 months (SPTE +42.4%, UMMA +36.5%, HLAL +29.7%, SPUS +24.2%); SPRE and MNZL trailed.
- 2Cross-standard agreement is partial even inside halal funds: 74.7% of SPUS weight and 84.0% of HLAL weight pass all five standards; SPTE drops to 60.3% and SPRE to 19.5% under FTSE/MSCI asset-based screens.
- 3The US broad funds are near-substitutes: SPUS-HLAL overlap is 67.6% by weight; real diversification comes from combining sleeves (US core, tech, international, REIT, sukuk), not from stacking broad US funds.